Mandelbrot set plotter
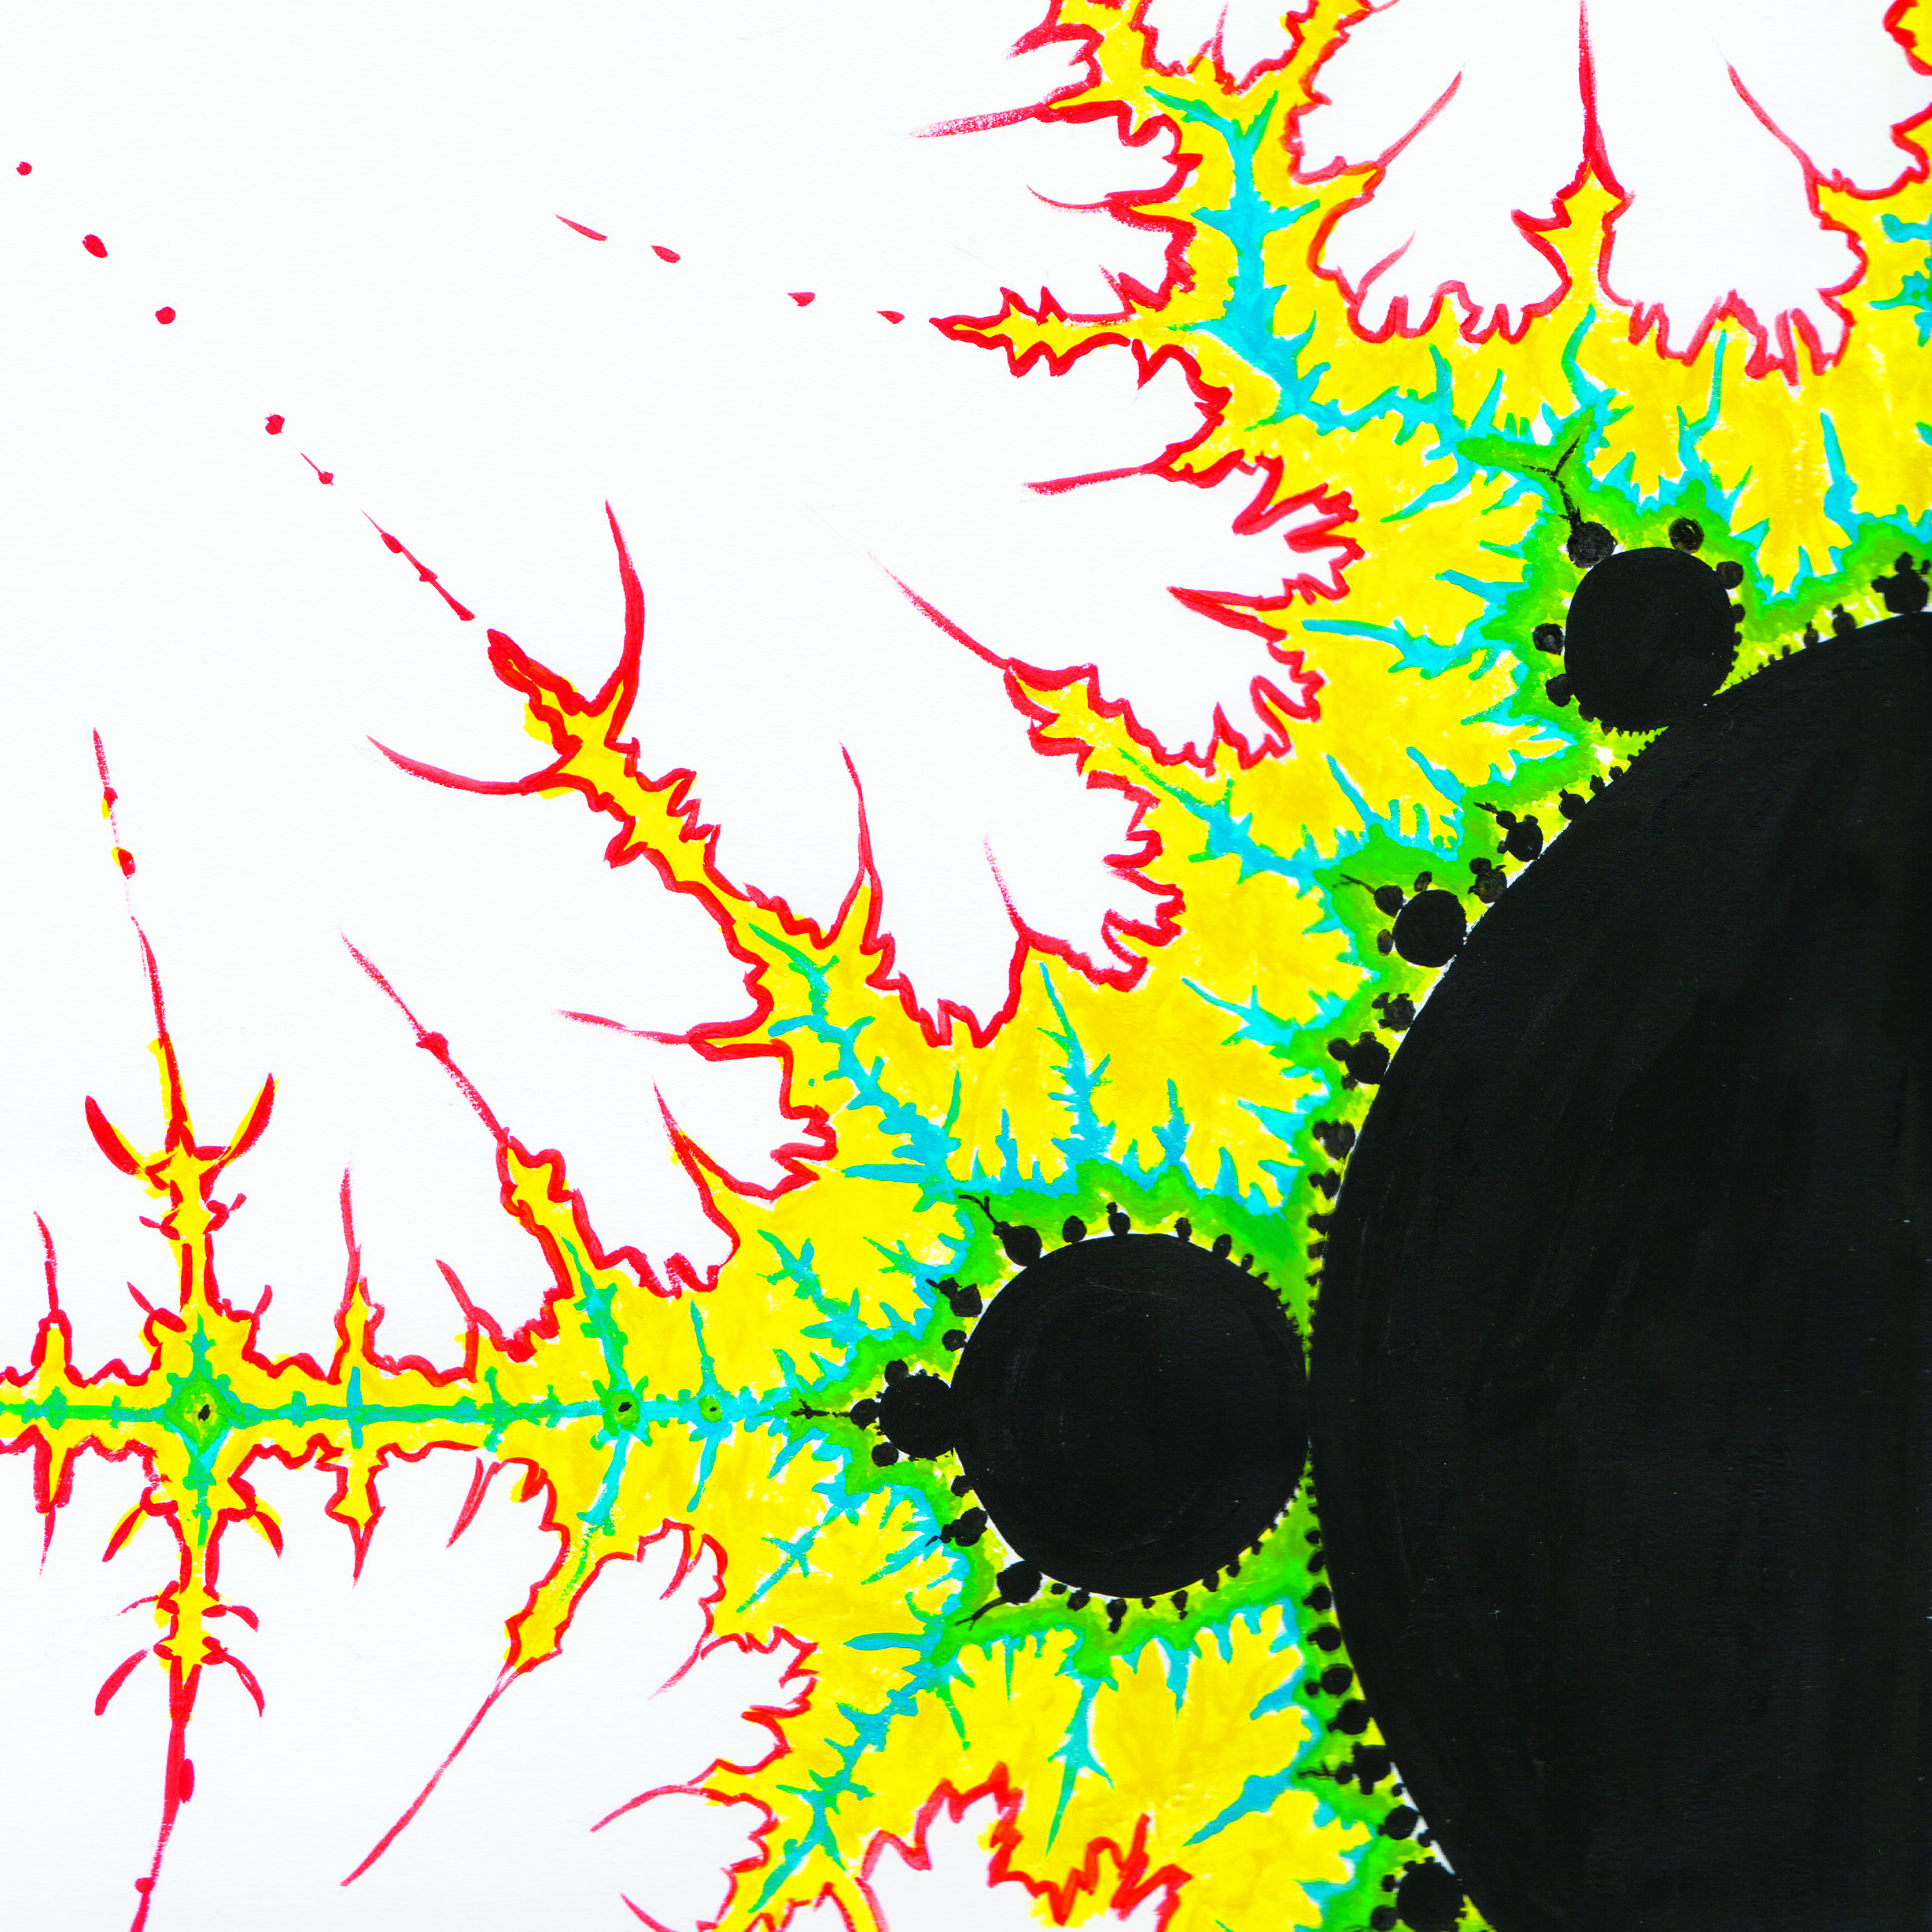
The Mandelbrot set is a fractal, probably the most famous one at that. It is plotted over the complex plane, it is very simple to plot the Mandelbrot set. The plotter iterates over all the points in the real axis and over all the points in the imaginary axis, so it goes over all the points. Its equation is \( z=z^2+c \) where \(c\) is the point on the complex plane which you started at. Now at every point in the complex plane it applies the equation (initially \( z=0 \) ) then it takes the result and enters it into the equation again. So now \( z=(z^2+c)^2 + c \) and this goes on and on. One of two things may happen: the result might increase out of bound or it may stay within a certain boundary. The boundary imposed by the Mandelbrot set is the quantity 2, such that if the point we are evaluating stays within the boundary, we color it black (usually). While if the point increases beyond the number 2 at one point it is colored with a hue that determines at what iteration (number of the loop) it surpassed the number 2.